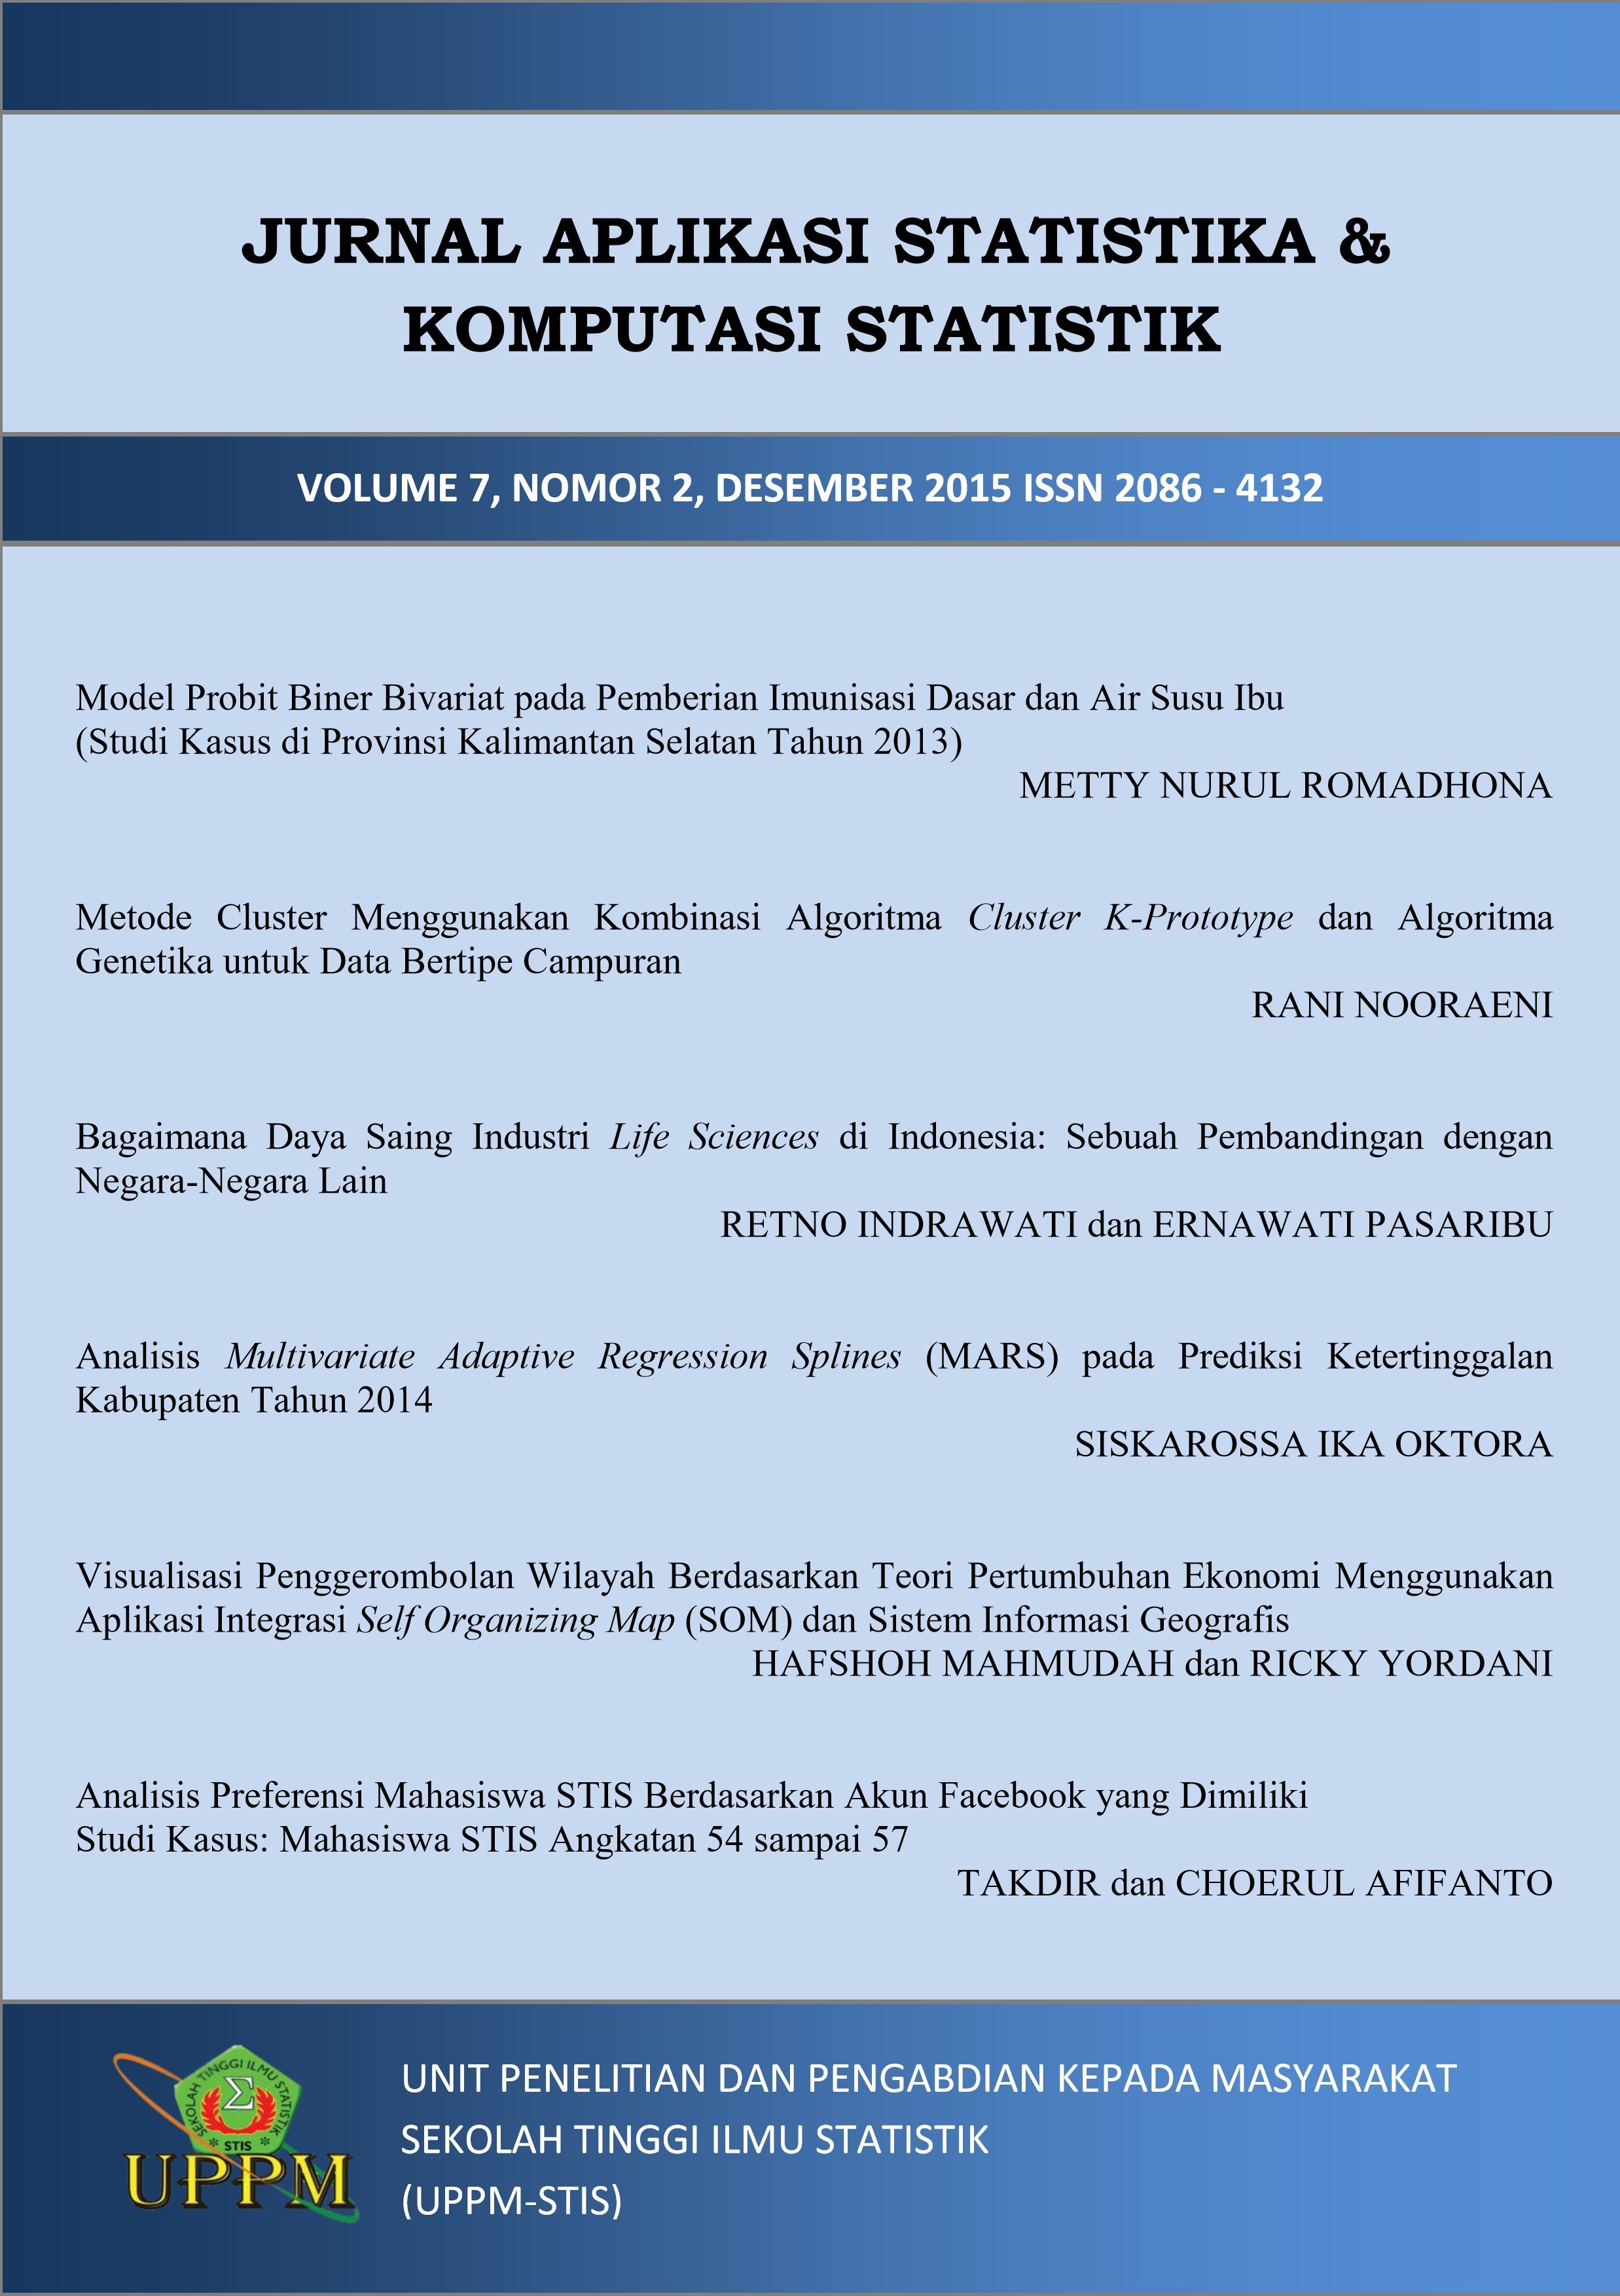
Visualization od Clustering Region by Economic Growth Theory Using The Integration Self Organizing Map (SOM) and Geographic Information System
DOI:
https://doi.org/10.34123/jurnalasks.v7i2.21Keywords:
Economic Growth Pole, Self Organizing Map, Cluster AnalysisAbstract
Economic growth is one of factor that is critical to determining the welfare of a region. However, differences in geographical conditions and the potential of the area led to differences in economic conditions differ between regions. The case studies conducted on Central Java Province because it is one of the largest contributors to GDP in Indonesia, which still has economic inequality between cities and between districts. To make more easy for visualize the economic growth, researcher then made an application that is able to easily see the effect of growth and clustering in the province of Central Java. There are many methods that can be used for cluster analysis. One of the most common methods used are the K-Means. However, K-Means has some drawbacks. One alternative method is using the Self Organizing Map (SOM) which is capable clustering accompanied by visualization of multidimensional data with techniques Unsupervised Artificial Neural Network. This application allows visualization and analysis because it is integrated with Geographic Information Systems (GIS). Applications are made subsequently used to analyze clustering with case study data of Central Java province. The resulting visualization capable of showing a pattern of economic growth in Central Java Province
Downloads
References
Amri, Amir. (2007). Pengaruh Inflasi dan Pertumbuhan Ekonomi Terhadap Pengangguran di Indonesia. Jambi: Jurnal Inflasi dan Pengangguran, Vol. I no. 1.
Badan Pusat Statistik. (2011). Produk Domestik Regional Bruto Atas Dasar Harga Konstan 2000 Menurut Provinsi, 2006-2010 (Milyar Rupiah). http://bps.go.id/. (Diakses 19 Mei, 2015.)
Badan Pusat Statistik Provinsi Jawa Tengah. (2008). Jawa Tengah Dalam Angka 2008. Semarang: BPS Provinsi Jawa Tengah.
Badan Pusat Statistik Provinsi Jawa Tengah. (2009). Jawa Tengah Dalam Angka 2009. Semarang: BPS Provinsi Jawa Tengah.
Badan Pusat Statistik Provinsi Jawa Tengah. (2010). Jawa Tengah Dalam Angka 2010. Semarang: BPS Provinsi Jawa Tengah.
Badan Pusat Statistik Provinsi Jawa Tengah. (2011). Jawa Tengah Dalam Angka 2011. Semarang: BPS Provinsi Jawa Tengah.
Chen, Hao. (2010). Comparative Study of C, C++, C and Java Programming Languages. Finland: University of Applied Sciences.
Demuth, H. dan Beale, M.H. (2003). Neural Network Toolbox for Use with MATLAB. USA: The MathWorks, Inc.
Glasson, John. (1974). An Introduction to Regional Planning. London: Hucthinson and Co Publisher Ltd.
Han, J. dan Kamber, M. (2001). Data Mining: Concepts and Techniques. USA: Academic Press.
Isnainy, Mira Ayu. (2012). Kinerja Perekonomian Kabupaten/Kota di Provinsi Jawa Tengah Periode 19832010. [Skripsi]. Jakarta: STIS.
Jain, A. K. dan Dubes, R. C. (1998). Algorithm for Clustering Data. New Jesrsey: Prentice Hall.
Karima, Kourtit (2012). Benchmarking of World Cities through Self Organizing Maps. Amsterdam: vrije Universiteit Amsterdam.
Komite Percepatan dan Perluasan Pembangunan Ekonomi Indonesia. (2015). Kerangka Acuan Kerja (KAK). Jakarta: Kementerian Koordinator Bidang Perekonomian.
Kumar, Satish dan Asger, Mohammed (2015). Analysis Clustering Techniques in Biological Data with R. International Journal of Computer Science and Information Technologies. Vol 6(2), 1859-1864.
Kulkarani, Rajendra. (2002). A Kohonen Self Organizing Map Approach to Modeling Growth Pole Dynamics. Journal Network and Spatial
Economics 2, page 175-189.
Larose, D.T. (2004). Discovering Knowledge in Data: An Introduction to Data Mining. USA: John WileySons Inc.
Li, Yan. (2007). Social Area Analysis Using SOM and GIS. Ritsumeikan Center for Asia Pacific Studies: Ritsumeikan Asia Pacific University.
Mangiameli, P., Chen, S. K. dan West, D. (1996). A Comparison of SOM Neural Network and Hierachical Clustering Method. European Journal of Operational Reserach, 93, 402-417.
Nuningsih, S. (2010). K-Means Clustering (Studi Kasus Pada Data Pengujian Kualitas Susu di Koperasi Peternakan Bandung Selatan. [Skripsi]. Bandung:UPI.
Oja, M, Kaski, S. dan Kohonen, T. (2002). Bibliography of Self Organizing Map (SOM) Papers. 1998-2001.http://www.cis.hut.fi/4D56A06 9-A106-4B00-B4D68BA39A0EC385/Final
Download/DownloadId-823AF7FF0046E49553BA41F318708C79/4D56A069-A106-4B00-B4D6-8BA39A0EC385/research/refs/NCS_vol3_1.pdf.(Diakses 1 September, 2015)
Salazar, E.J dkk. (2002). A Cluster Validity Index for Comparing Non Hierarchical Clustering Methods. http://citeseerx.ist.psu.edu/viewdoc/download?doi=10.1.1.19.5206&rep=rep1type=pdf (Diakses 10 Mei, 2015) Santoso, S. (2010). Statistik Multivariat. Jakarta: PT Elex Media Komputindo.
Siang, J. J. (2009). Jaringan Syaraf Tiruan dan Pemrogramannya Menggunakan MATLAB (Ed. II). Yogyakarta: Andi Offset.
Sukirno, Sadono. (2006). Ekonomi Pembangunan: Proses, Masalah, dan Dasar Kebijakan. Jakarta: Kencana.
Turban, Efraim dkk. (2005). Introduction to Information Technology, 3rd Edition. New York: John Wiley Sons, Inc.
Wang Huai-Bin, dkk.(2010). A Clustering Algorithm Use SOM and K-Means in Intrusion Detection. International Conference E-Business and E- Government (ICEE): 1281-1284. Guangzhou.
Yin, Huyun. (2012). The Self Organizing Maps: Background, Theories, Extensions and Applications. Berlin: Springer.


